 math
Percentages, Ratios and Averages: A Practical Everyday Math Guide
Percentages, ratios and averages are the most-used math in adult life, and also the most-misunderstood. A "50% off then 20% off" sign, a news headline about rising prices, a split bill — all of it rests on these three ideas. Over the years I have seen smart people make the same small errors again and again, so this guide focuses on getting them right.
Here is a practical walkthrough of everyday math, with examples you can reuse immediately.
Percentages: the core move
A percentage is just a fraction of 100. To find a percentage of a number, divide the percentage by 100 and multiply.
15% of 80 = 0.15 × 80 = 12
To go the other way — what percent one number is of another — divide and multiply by 100.
12 out of 80 = 12 ÷ 80 × 100 = 15%
That is the whole foundation. A quick percentage calculator handles these instantly, but knowing the move keeps you from being fooled by a confusing label.
Percentage change vs percentage points
This is the single most common source of misleading statistics, and worth internalising.
- Percentage points are a simple subtraction. Going from 10% to 15% is a rise of 5 percentage points.
- Percentage change is relative. That same move from 10% to 15% is a 50% increase (the gap, 5, divided by the starting value, 10).
Headlines exploit this gap constantly. "Interest rates up 50%!" sounds alarming, but if the rate went from 2% to 3%, that is only one percentage point. When you read a statistic, ask which one is meant.
The discount trap
Stacked discounts do not add up the way people assume. "50% off, then an extra 20% off" is not 70% off.
Start at $100 → 50% off = $50 → 20% off that = $40
That is a 60% total discount, not 70%. The second percentage applies to the already-reduced price.
Ratios: comparing quantities
A ratio compares two or more quantities, like 2:3. Ratios are everywhere — mixing paint, scaling a recipe, splitting profits.
The key skill is scaling a ratio while keeping it equivalent. A 2:3 ratio is the same as 4:6 or 20:30. To split a total by a ratio:
- Add the parts: 2 + 3 = 5.
- Divide the total by that sum.
- Multiply each part.
Split $500 in a 2:3 ratio → $500 ÷ 5 = $100 per part → $200 and $300.
Averages: mean, median and mode
"Average" usually means the mean, but it is not always the right one.
- Mean: add everything, divide by the count. Best for evenly spread data.
- Median: the middle value when sorted. Best when there are outliers.
- Mode: the most frequent value. Useful for categories and repeated values.
When the mean lies
Imagine five salaries: $30k, $32k, $35k, $38k and $1,000k. The mean is about $227k, which describes nobody in the room. The median — $35k — represents the typical person far better.
This is why income, house prices and response times are almost always reported as medians. Whenever data has extreme values, reach for the median. A mean, median and mode tool computes all three so you can compare them directly.
Reading statistics without being fooled
Once you are comfortable with the math, the real-world payoff is spotting when numbers are being used to mislead — often without any lie being told.
- Relative vs absolute risk. "This doubles your risk!" sounds terrifying until you learn the risk went from 1 in a million to 2 in a million. A doubling of a tiny number is still tiny. Always ask for the absolute figures behind a percentage change.
- Base rates matter. "70% of buyers chose the premium plan" means little if only ten people bought. Percentages from small samples swing wildly and should be treated with caution.
- Averages hide distributions. An "average wait time of 10 minutes" might mean everyone waits 10 minutes, or half wait 2 and half wait 18. The mean alone cannot tell you, which is why the median and the spread matter.
- Cherry-picked baselines. "Sales up 200% since our worst month ever" is a classic. The starting point was chosen to flatter the number.
A quick gut-check habit
When a statistic surprises you, do three things: find the absolute numbers, check the sample size, and ask compared to what. That trio deflates most misleading claims in seconds, and it turns the everyday math in this guide from classroom theory into a practical defence against spin.
Putting it together: a worked scenario
You and three friends share a $180 dinner bill, but you agreed to cover 40% because you ordered more.
- Your share: 40% of $180 = 0.40 × 180 = $72.
- The remaining $108 splits equally among three: $108 ÷ 3 = $36 each.
Every step is just the core moves above — a percentage, then a simple division. For quick checks like tips and splits, a tip calculator removes the mental arithmetic entirely.
The takeaway
Everyday math rewards a few clear habits: treat a percentage as "divide by 100 and multiply", never confuse percentage points with percentage change, remember that stacked discounts multiply rather than add, and choose the median over the mean whenever outliers are lurking. Master those, and you will read statistics more critically and handle money math with confidence — reaching for a percentage calculator only to save time, not to do the thinking for you.
Frequently Asked Questions
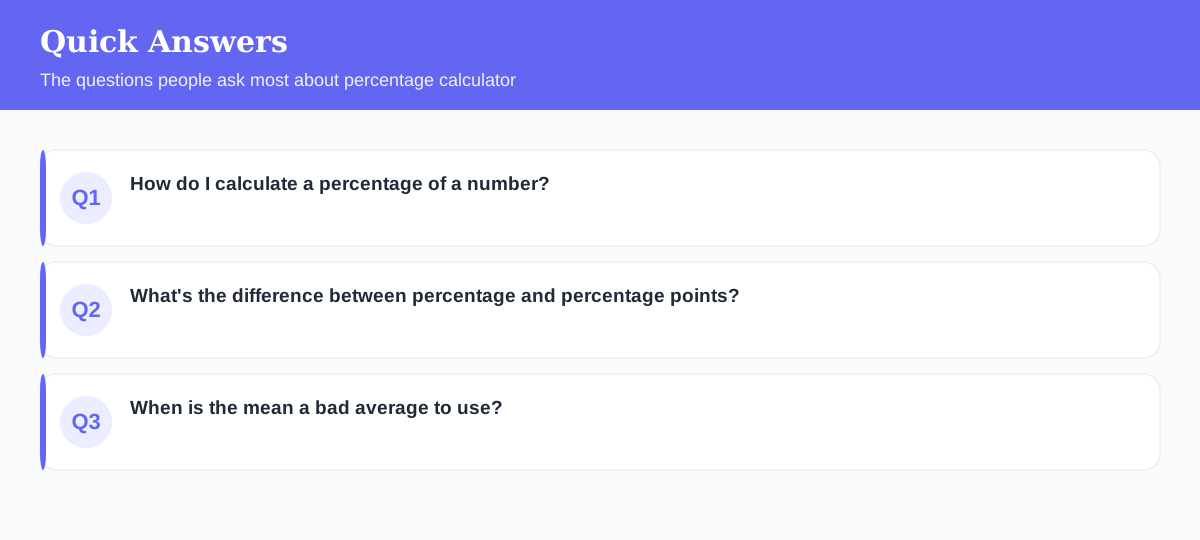
How do I calculate a percentage of a number?
Divide the percentage by 100 and multiply. 15% of 80 is 0.15 x 80 = 12. To find what percent one number is of another, divide and multiply by 100.
What's the difference between percentage and percentage points?
Going from 10% to 15% is a 5 percentage point rise but a 50% relative increase. Mixing them up is a very common source of misleading statistics.
When is the mean a bad average to use?
When data has extreme outliers — like incomes or house prices — the median usually represents 'typical' far better than the mean.
Explore 500+ Free Online Tools
No sign-up. No cost. Forever free — for developers, writers & creators.